BRIC analysis and country growth into 2050
Global situation
The BRIC (Brazil, Russia, India, China) countries have been set to grow over the next few years at record amounts, but they are definitely not the only markets to consider for growth. As quoted by BusinessWeek, Jim O’Neill (chairman of Goldman Sachs Asset Management) “the economist who coined the term “BRIC” is now revising the definition he made famous…decided to drop the term BRIC. That’s because he’s adding Mexico, South Korea, Turkey, and Indonesia to the previous BRIC countries, and referring to the group as ‘growth markets.'” Additionally, geographic areas that are expanding include Taiwan, Vietnam, Nigeria and the Balkans.
Another BusinessWeek article, on the next 11 emerging countries, highlights how nations with huge growth potentials are emerging around the globe: with Asia( Indonesia, South Korea, Vietnam), Africa (South Africa, Egypt), Latin America(Mexico, Chile, Argentina), and Turkey all set for growth. “These countries are characterized by youth and urbanized populations combined with rising incomes and the expansion of the middle class,” said John Kelly from independent financial advisers Chelsea Financial Services. These markets are perfect also for new technologies as the youth adopt new innovations more easily than older generations. A more detailed analysis from 2011 to 2030 will follow in further sections and is based on macro perspectives on GDP growth applicable to all industries and sectors.
2011-2030
Due to the uncertainty in predicting longer periods, the long term trends will be more suggestive than indicative as trends could change drastically in the future. As such, trends should be looked at in the short term (2011-2015) and long term (2015-2030). The following graph shows predicted GDP growth from 2010 and projected until 2050.

GDP growth until 2050
The total growth in GDP seems to indicate that by 2020 the USA will have the biggest economy with China close behind followed by Japan and the EU region. However, by 2030 China has become the biggest economy followed by the USA and then maybe the EU and India close behind. The diagram shows that India’s economy should become important in total output by about 2040 and 2050, but until then it is just a high growth market and maybe the opportunities will be limited in terms of total potential. The GDP does not take into account the consumption of the market, only the production, so these high growth areas will become high growth consumers as well.
GDP Growth Projections
Based on the data taken from a Goldman Sachs report on the BRIC and N11 nations, the following graphs have been created in the rest of this post.
(Click on the images to get interactive graphs)
Country Breakdown
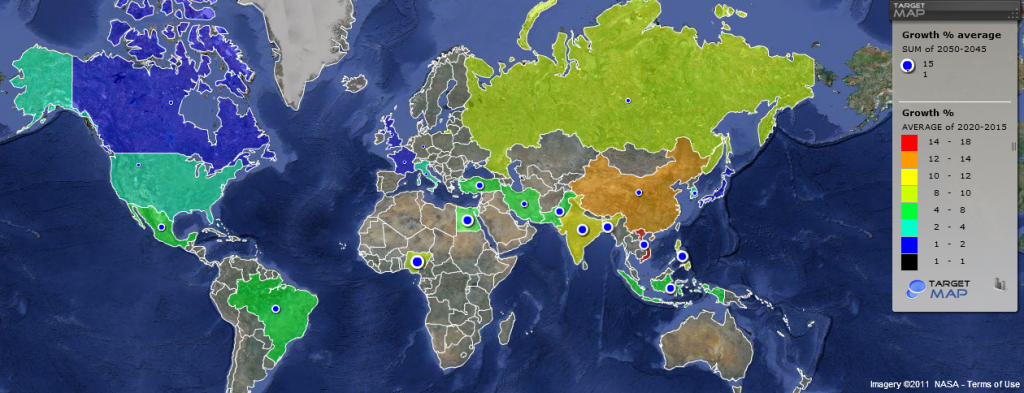
GDP Growth Rates Averaged per Period
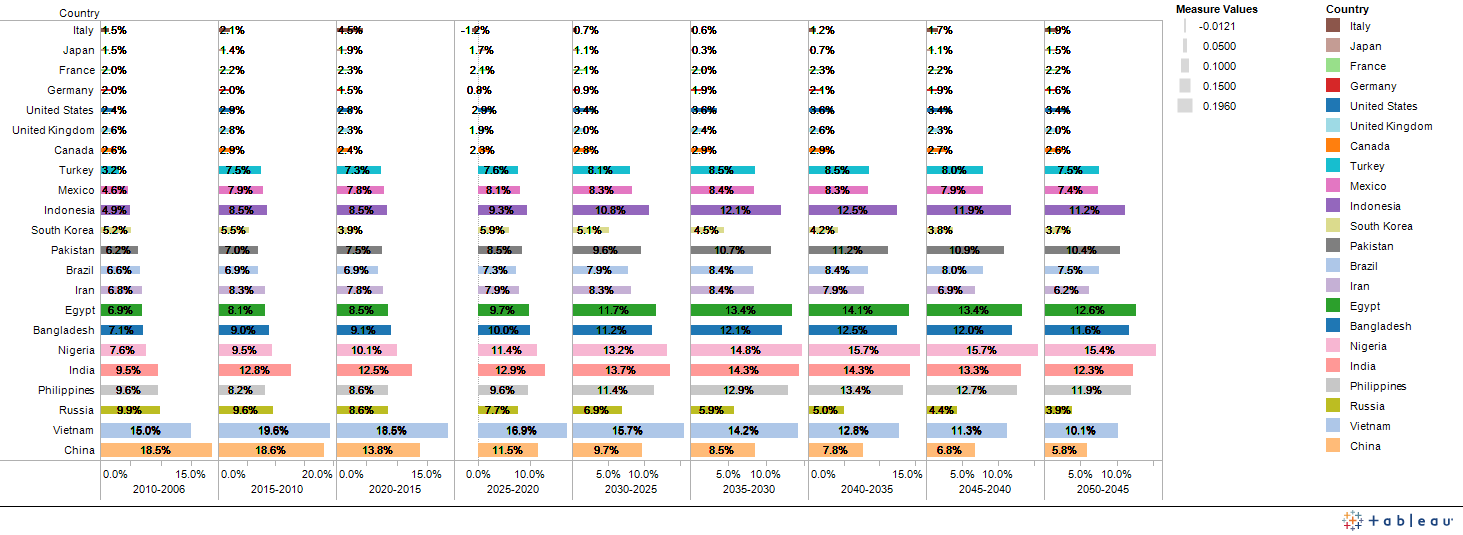 Looking at an average growth rate within each 5 year period, based on the GDP growth data above, between 2010 and 2020 China, India, Vietnam and Nigeria are leading growth around 10-18%; compared to Japan, the US and Europe at about 1.5-3%. From 2020-2030 the situation doesn’t change much but China’s economy stops growing at such impressive rates down to about 9%, from 18%, while Nigeria seems to grow. Maybe this indicates that Africa will develop more within the 2020-2030 period, where as China is reaching a plateau and its economic growth will start saturating and move more towards domestic consumption and importing rather than export driven.
GDP Growth Rates and Multiples from 2010
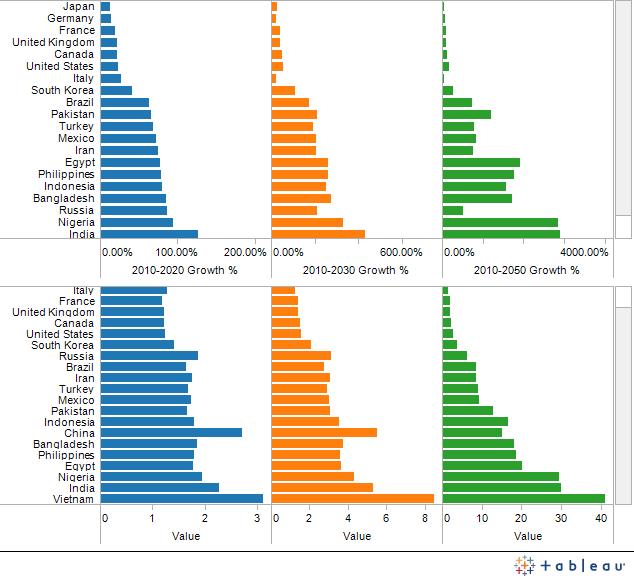 If we look at specific countries, between 2010 and 2030, we can see that China and Vietnam are growing the most with India and Nigeria growing quickly too in terms of multiples and growth rates. In general, all of the G7 approximately double their GDP per Capita in 2050 compare to 2006, but the highest growth is made by Vietnam which will make their GDP per Capita 51.10x (2006 to 2050). The second and third best growth are made by BRIC countries: India (25.5x) and China (24.32x). The other two BRIC countries also achieve significantly growth: Russia (11.37x) and Brazil (8.79x). As a side note, Egypt’s growth was predicted to grow quite quickly, but its growth forecast was downgraded due to the recent unrest and change of government, which also affected infrastructure and shrunk their tourist industry (their main economic driver).
Regional Breakdown
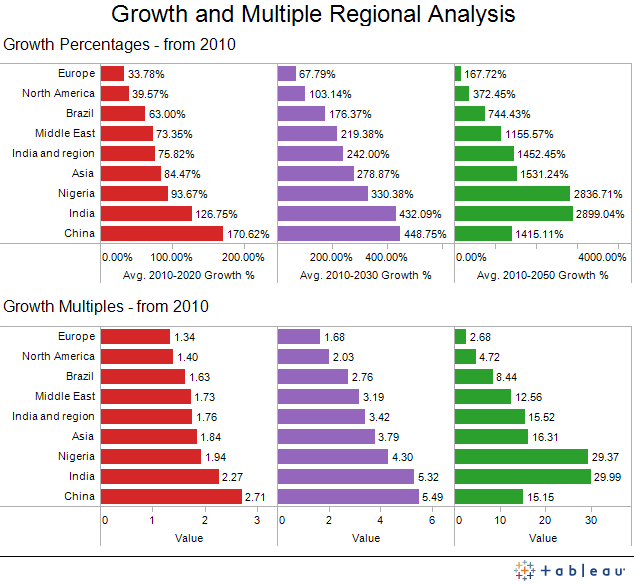 When looking at the growth per general region we can see that China and India, and their respective regions, are growing at the fastest rate in 2010 to 2020 and 2020 to 2030. The growth factors also indicate that the respective GDP is doubling in those areas as well, with Brazil slightly ahead of North America.
Self-Sufficiency
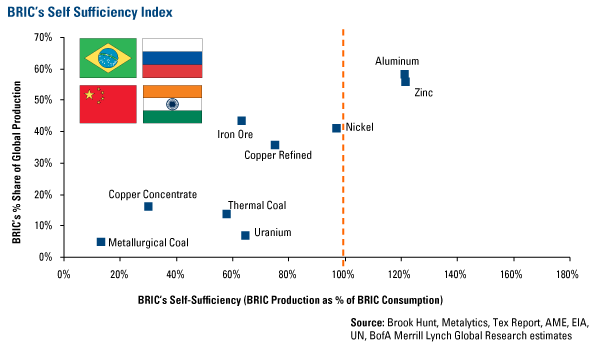 The self-sufficiency index is also very interesting as it shows how self-sufficient countries are at producing or sourcing the ingredients for their economic growth. In this case, the index only shows raw materials but also could be used as an analogy that growing markets don’t only show potential internally, but also externally by other nations, which can feed their growth. The economic cycle is as follows:
“AMSET stands for Agriculture, Manufacturing, Services, Experiential and Transformational. The first three contribute to the current economies of globe in varying proportions, while the remaining two-Experiential and Transformational are the expected areas which will contribute more to the economies in future.”
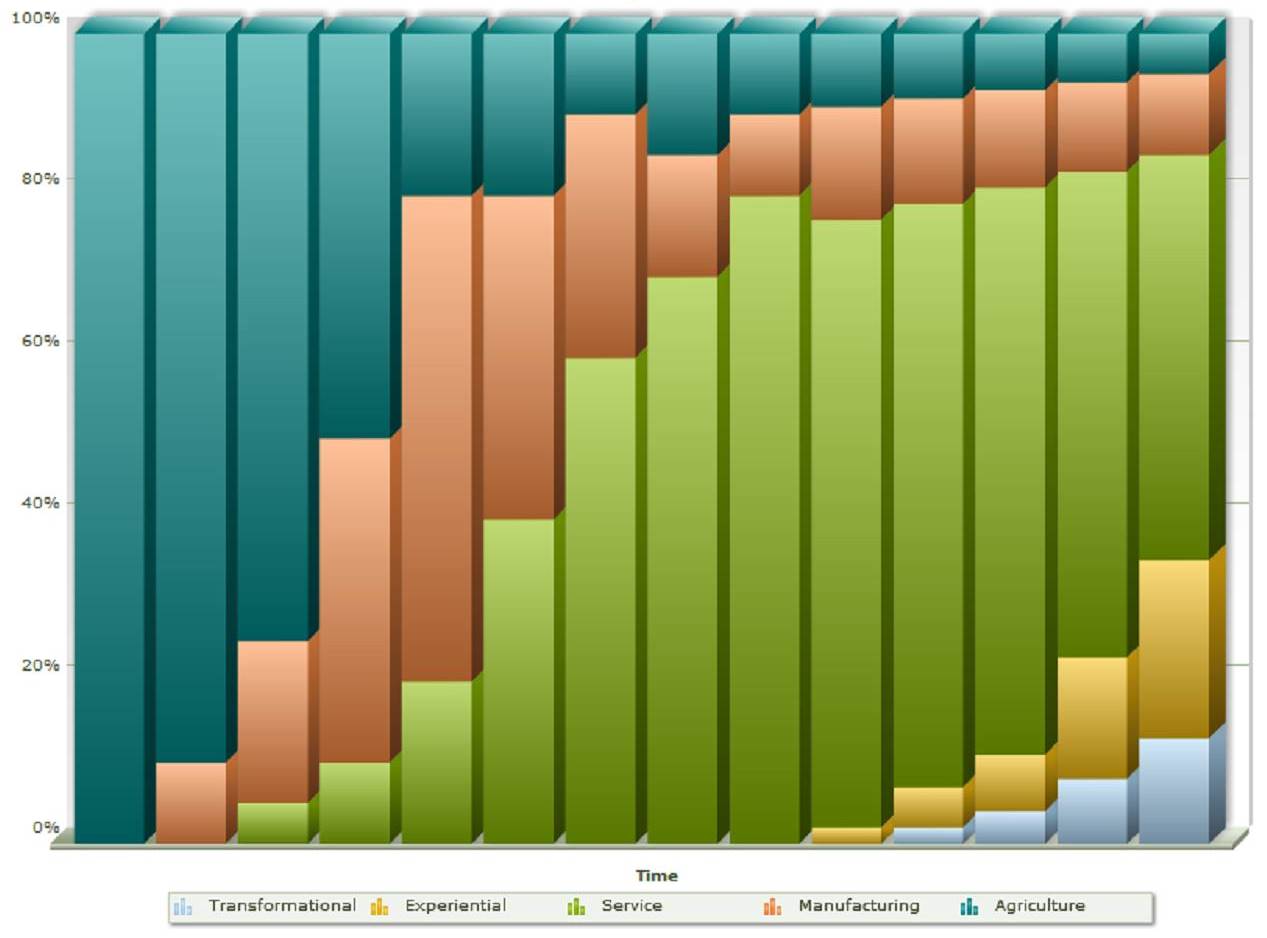 The classification for each stage in the evolution of products is:
- A commodity business charges for undifferentiated products.
- A goods business charges for distinctive, tangible things.
- A service business charges for the activities you perform.
- An experience business charges for the feeling customers get by engaging it.
- A transformation business charges for the benefit customers (or “guests”) receive by spending time there.
Service Economics
The list of services offered in 2009 shows that Europe is the leader followed by US and Japan. What is interesting to note is how China and Brazil are trailing in terms of service provisions and represent an opportunity.
The list of services offered in 2009, shows that Europe is the leader followed by US and Japan. What is interesting to note is how China and Brazil are trailing in terms of service provisions and represent an opportunity.
| Rank | Country | Service Output (millions of US$) | Service per GDP | Service Efficiency* |
| – | European Union | 11,973,605 | 70.5% | 80% |
| 1 | United States | 10,963,075 | 76.9% | 75% |
| 2 | Japan | 3,877,065 | 75.7% | 84% |
| 3 | Germany | 2,424,032 | 67.8% | 79% |
| 4 | France | 2,111,325 | 78.9% | 91% |
| 5 | China | 2,091,226 | 43.6% | 76% |
| 6 | United Kingdom | 1,637,705 | 80.4% | 69% |
| 7 | Italy | 1,548,451 | 73.3% | 82% |
| 8 | Brazil | 1,078,217 | 65.8% | 98% |
| 9 | Spain | 1,024,828 | ||
| 10 | Canada | 952,872 | 71.3% | 74% |
* Service efficiency = (Services GDP/GDP PPP)/population
When plotting the relevant data we get the following graph:
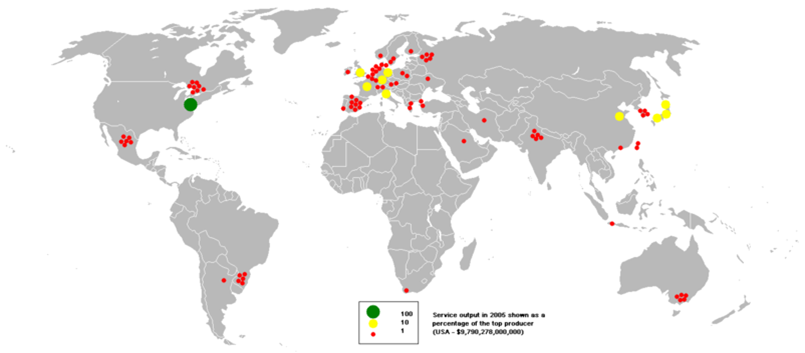
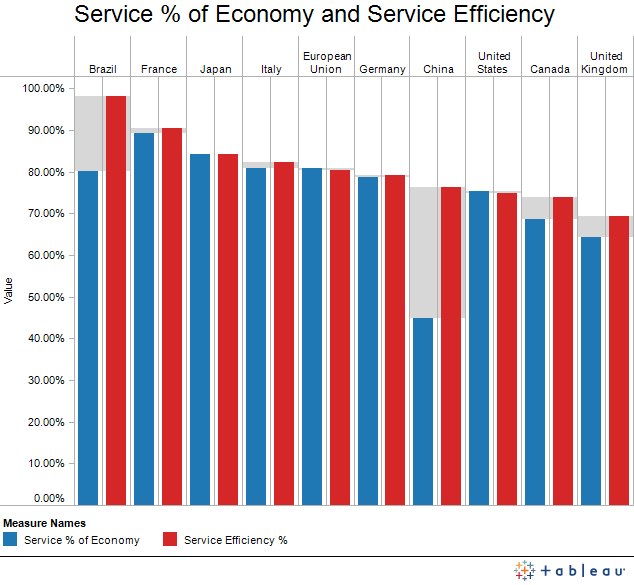 The table shows us that most countries have entered into a service based economy (around 80% GDP) with the exclusion of Canada, Italy, Germany, Brazil and China. Canada and Germany make sense since they still have a large manufacturing component. It also shows that these manufacturing countries currently represent good markets for services industries to grow within. Additionally, when we look at the services efficiency compared to the service sector size of the economy, we can observe that China’s gap is very high, which doesn’t mean they are more efficient, it means they actually lack manpower to provide self-sufficient services for their economy and would probably have to import them or grow them locally. Additionally, Brazil, Canada and the UK seem to be on similar footing. The service efficiency can also be related to how expensive the services are compared to the population delivering them. Thus, Brazil and France are seen as the most expensive location for services, and then correspondingly Canada and the UK are the least. Thus, the combination of both data shows how Canada and the UK are good places to grow their service industries, where as Brazil and France need to improve their service efficiency either through importing services or reducing the costs related to providing those services. However, this link corresponds to a macro scale, and might be more related to financial services. The following image also helps to support this conclusion.
The map shows the cities most invested in services. New York seems to be the biggest in the USA and Beijing in China; showing how financial services are probably the biggest contributor to GDP.
Summary
| Factor | Until 2020 | Until 2030 | Risks |
| Biggest markets | US , China, Japan, EU | China, US, EU, India | Only based on GDP production, not based on internal consumption |
| Biggest growing markets | Vietnam, China, India, and Nigeria (10-18%) | Vietnam, Nigeria , India, and China (10-18%) | China moves towards import market and internal consumption, or conversely internally they maintain a manufacturing based economy. |
| Service Self insufficiency | China, Brazil and potential in EU | China, Brazil | Unsure as to progression that Brazil and especially China will move towards services and away from manufacturing |
| Countries moving towards service economies | Canada, Italy, Germany, Brazil and China | Brazil and China | Brazil and China are more manufacturing, but Germany and Canada might still remain resource based as the self sufficiency of resources and manufactured goods is still low for the BRICs so they might source from them. |
On a macro level, we could say that China and maybe the EU (Germany in particular) represent good markets in terms of size and service opportunities. However, China seems to be the best for growth potential and internal service insufficiency. However, working in China faces challenges for westerners as it requires about 4 years to develop the right local connections, which could change at any moment due to government intervention and changes within both government and power structures within companies. Additionally, western workers have to establish the necessary language capabilities as local Chinese are sensing a disconnect between westerns understanding of the local Asian market. Hence, an ability to show proficiency in the language helps to create these cultural connections and facilitate relationships. Yet, after about 4 years time, China will be slowing its growth rate but still will remain high.
In some ways, sourcing services for China and Brazil provide good opportunities for growth. The only problem is that India is looking to provide technology based services, with an educated population and also a growing economy already specialized in some IT services. China is also looking at growing its IT services, by expanding into foreign markets, as Chinese are now speaking English well. Chinese companies are also looking to expand abroad in western markets, especially into resource based economies like Canada as well as areas in Africa. Never the less, the growth would not be as lucrative or fast unless the internal consumption fuels the growth of these other markets.
Thus, the BRIC countries still remain the most lucrative in terms of total growth rates and total GDP sizes. There still remains big potential within other markets around India (Bangladesh, Pakistan), South-East Asia (Philippines and Indonesia), and Africa (Nigeria in particular) as they hold potential for high growth economies and new business opportunities.

Hi, great post! Thanks..